Task 2 / two source report pages
Customer churn & risk analysis
Two native report views recreate the original exploratory and risk-analysis pages from the supplied customer workbook. They render runtime data, not screenshot pixels.
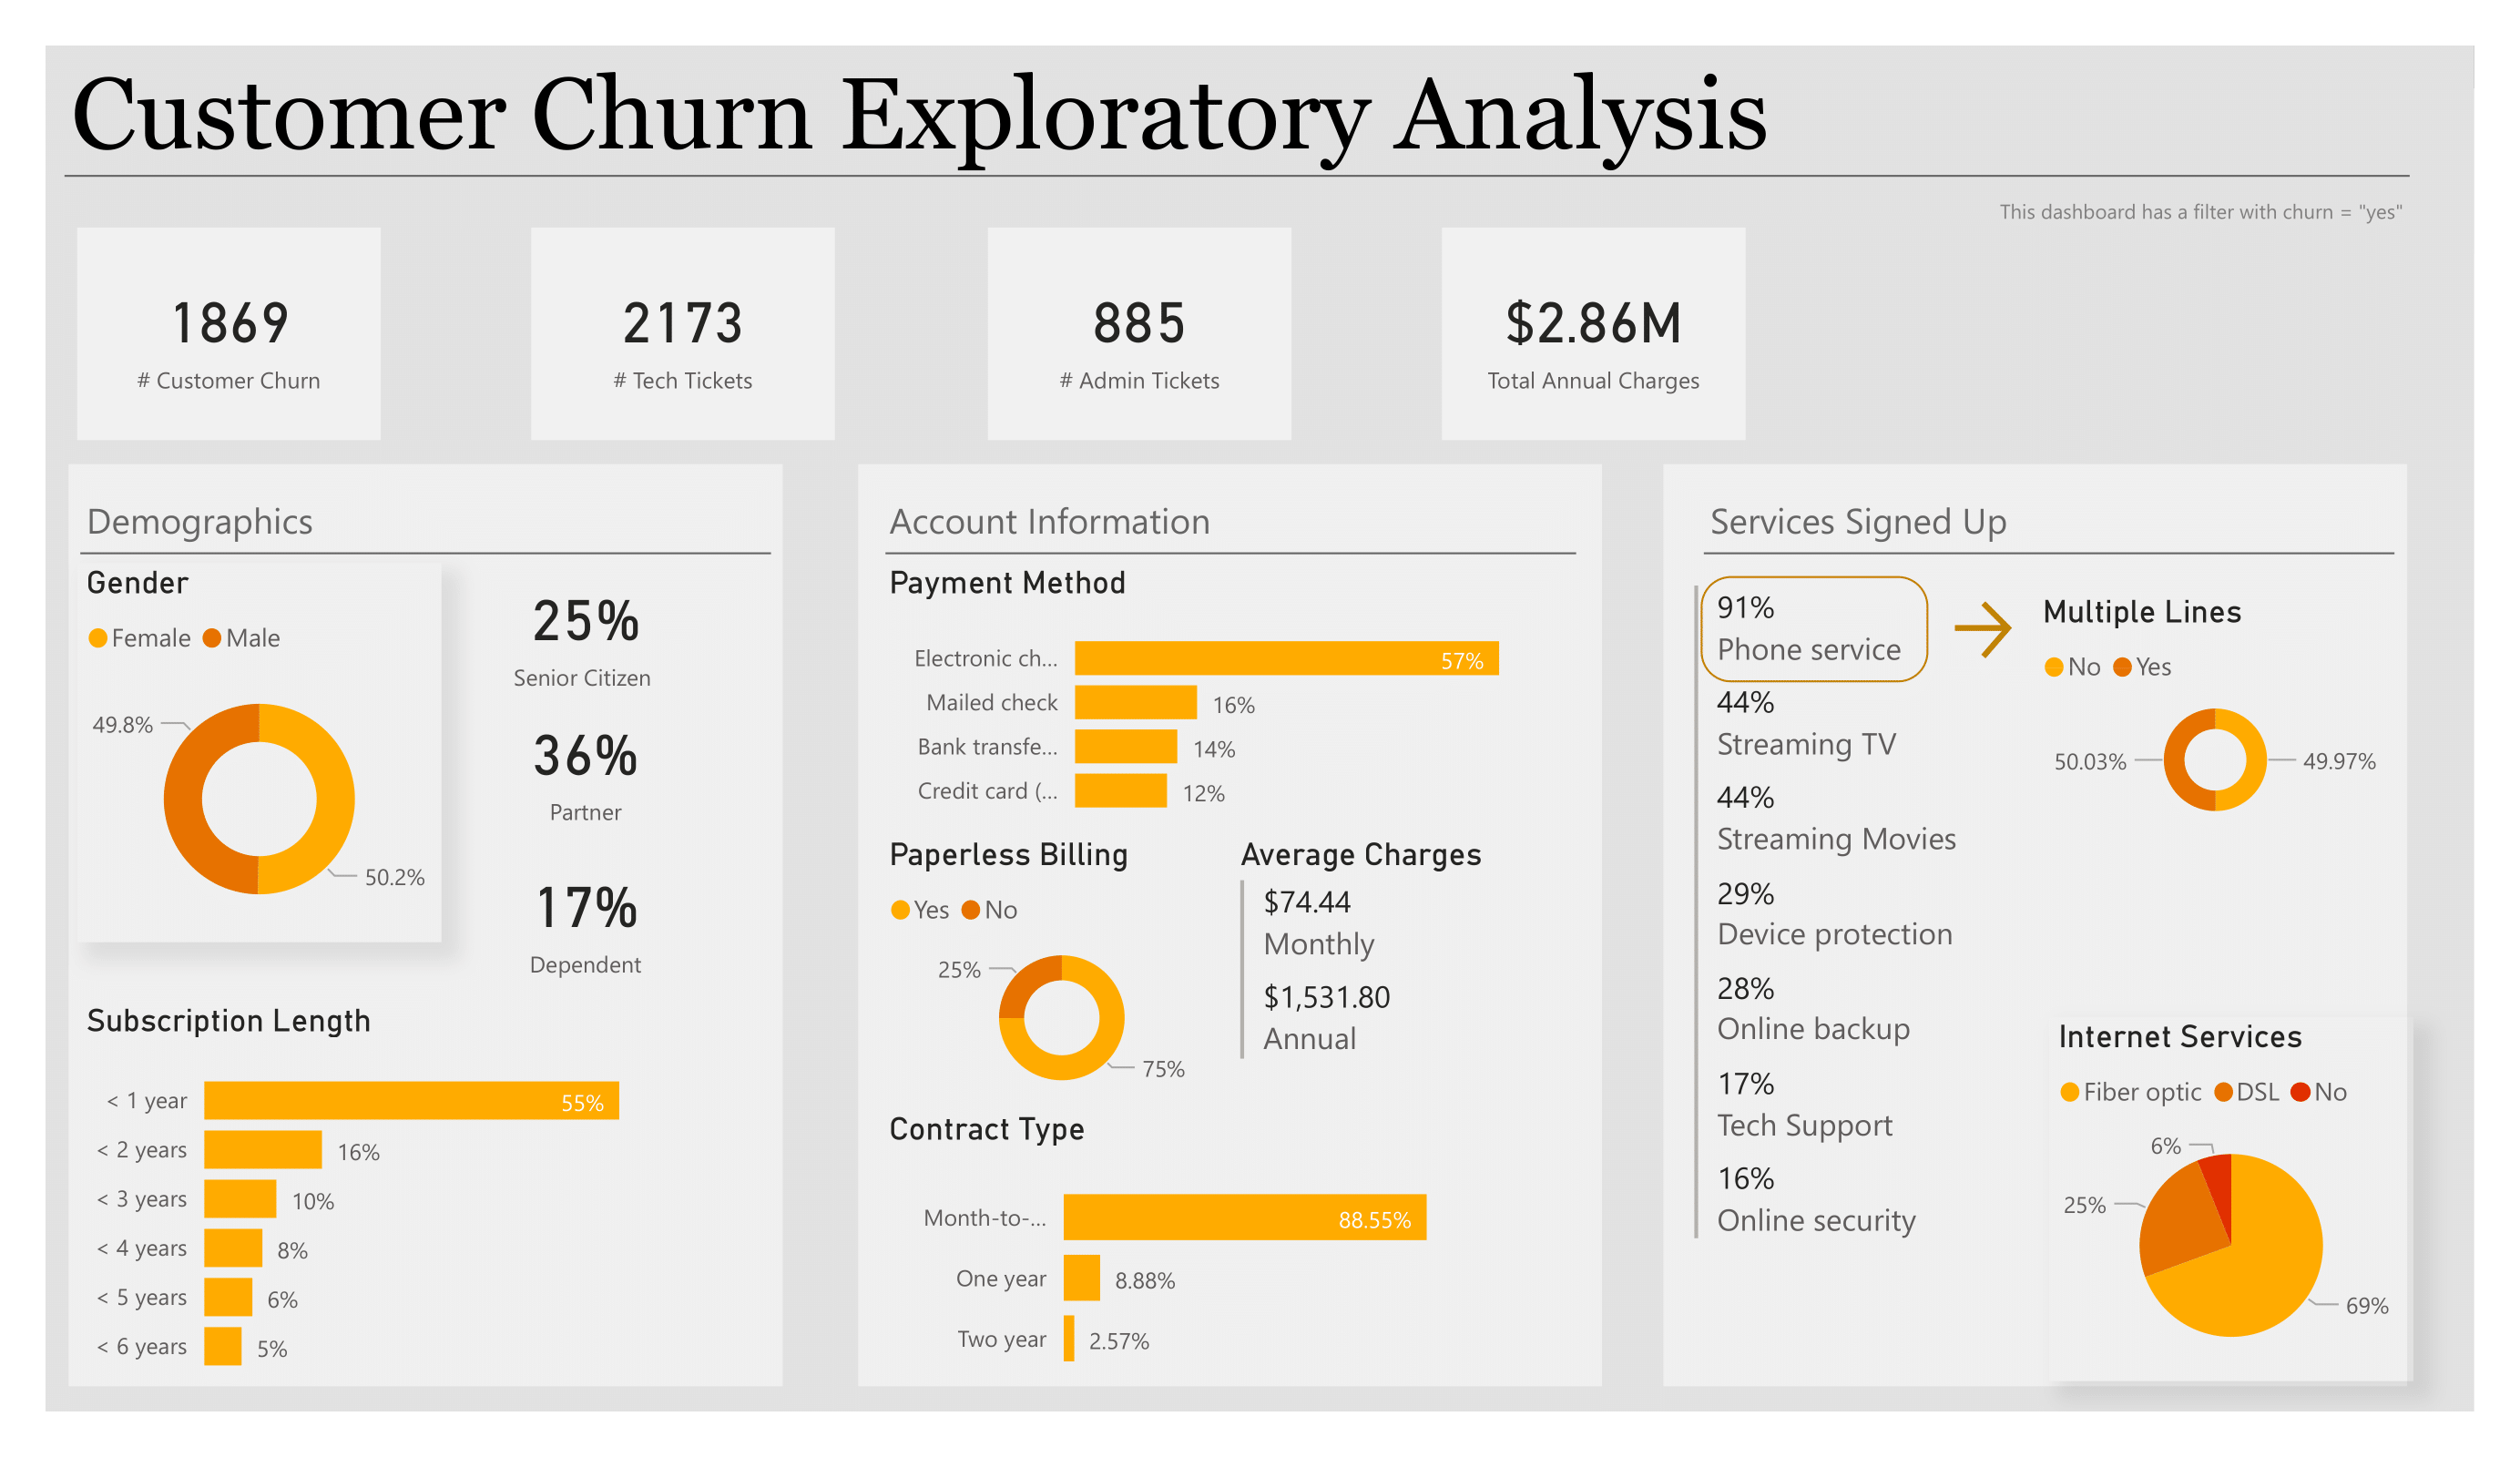
Original page 1 / customer churn exploratory dashboard
Profile the customers recorded as churned
This view applies the same outcome lens as the original page: each chart below is calculated over customers marked Churn = Yes.
Demographics
Gender and tenure
senior citizens; with partners; with dependents.
Account information
Payment, billing and contract
Average monthly charges: ; average total charges: .
Services signed up
Service adoption among churned customers
Internet service
Multiple lines
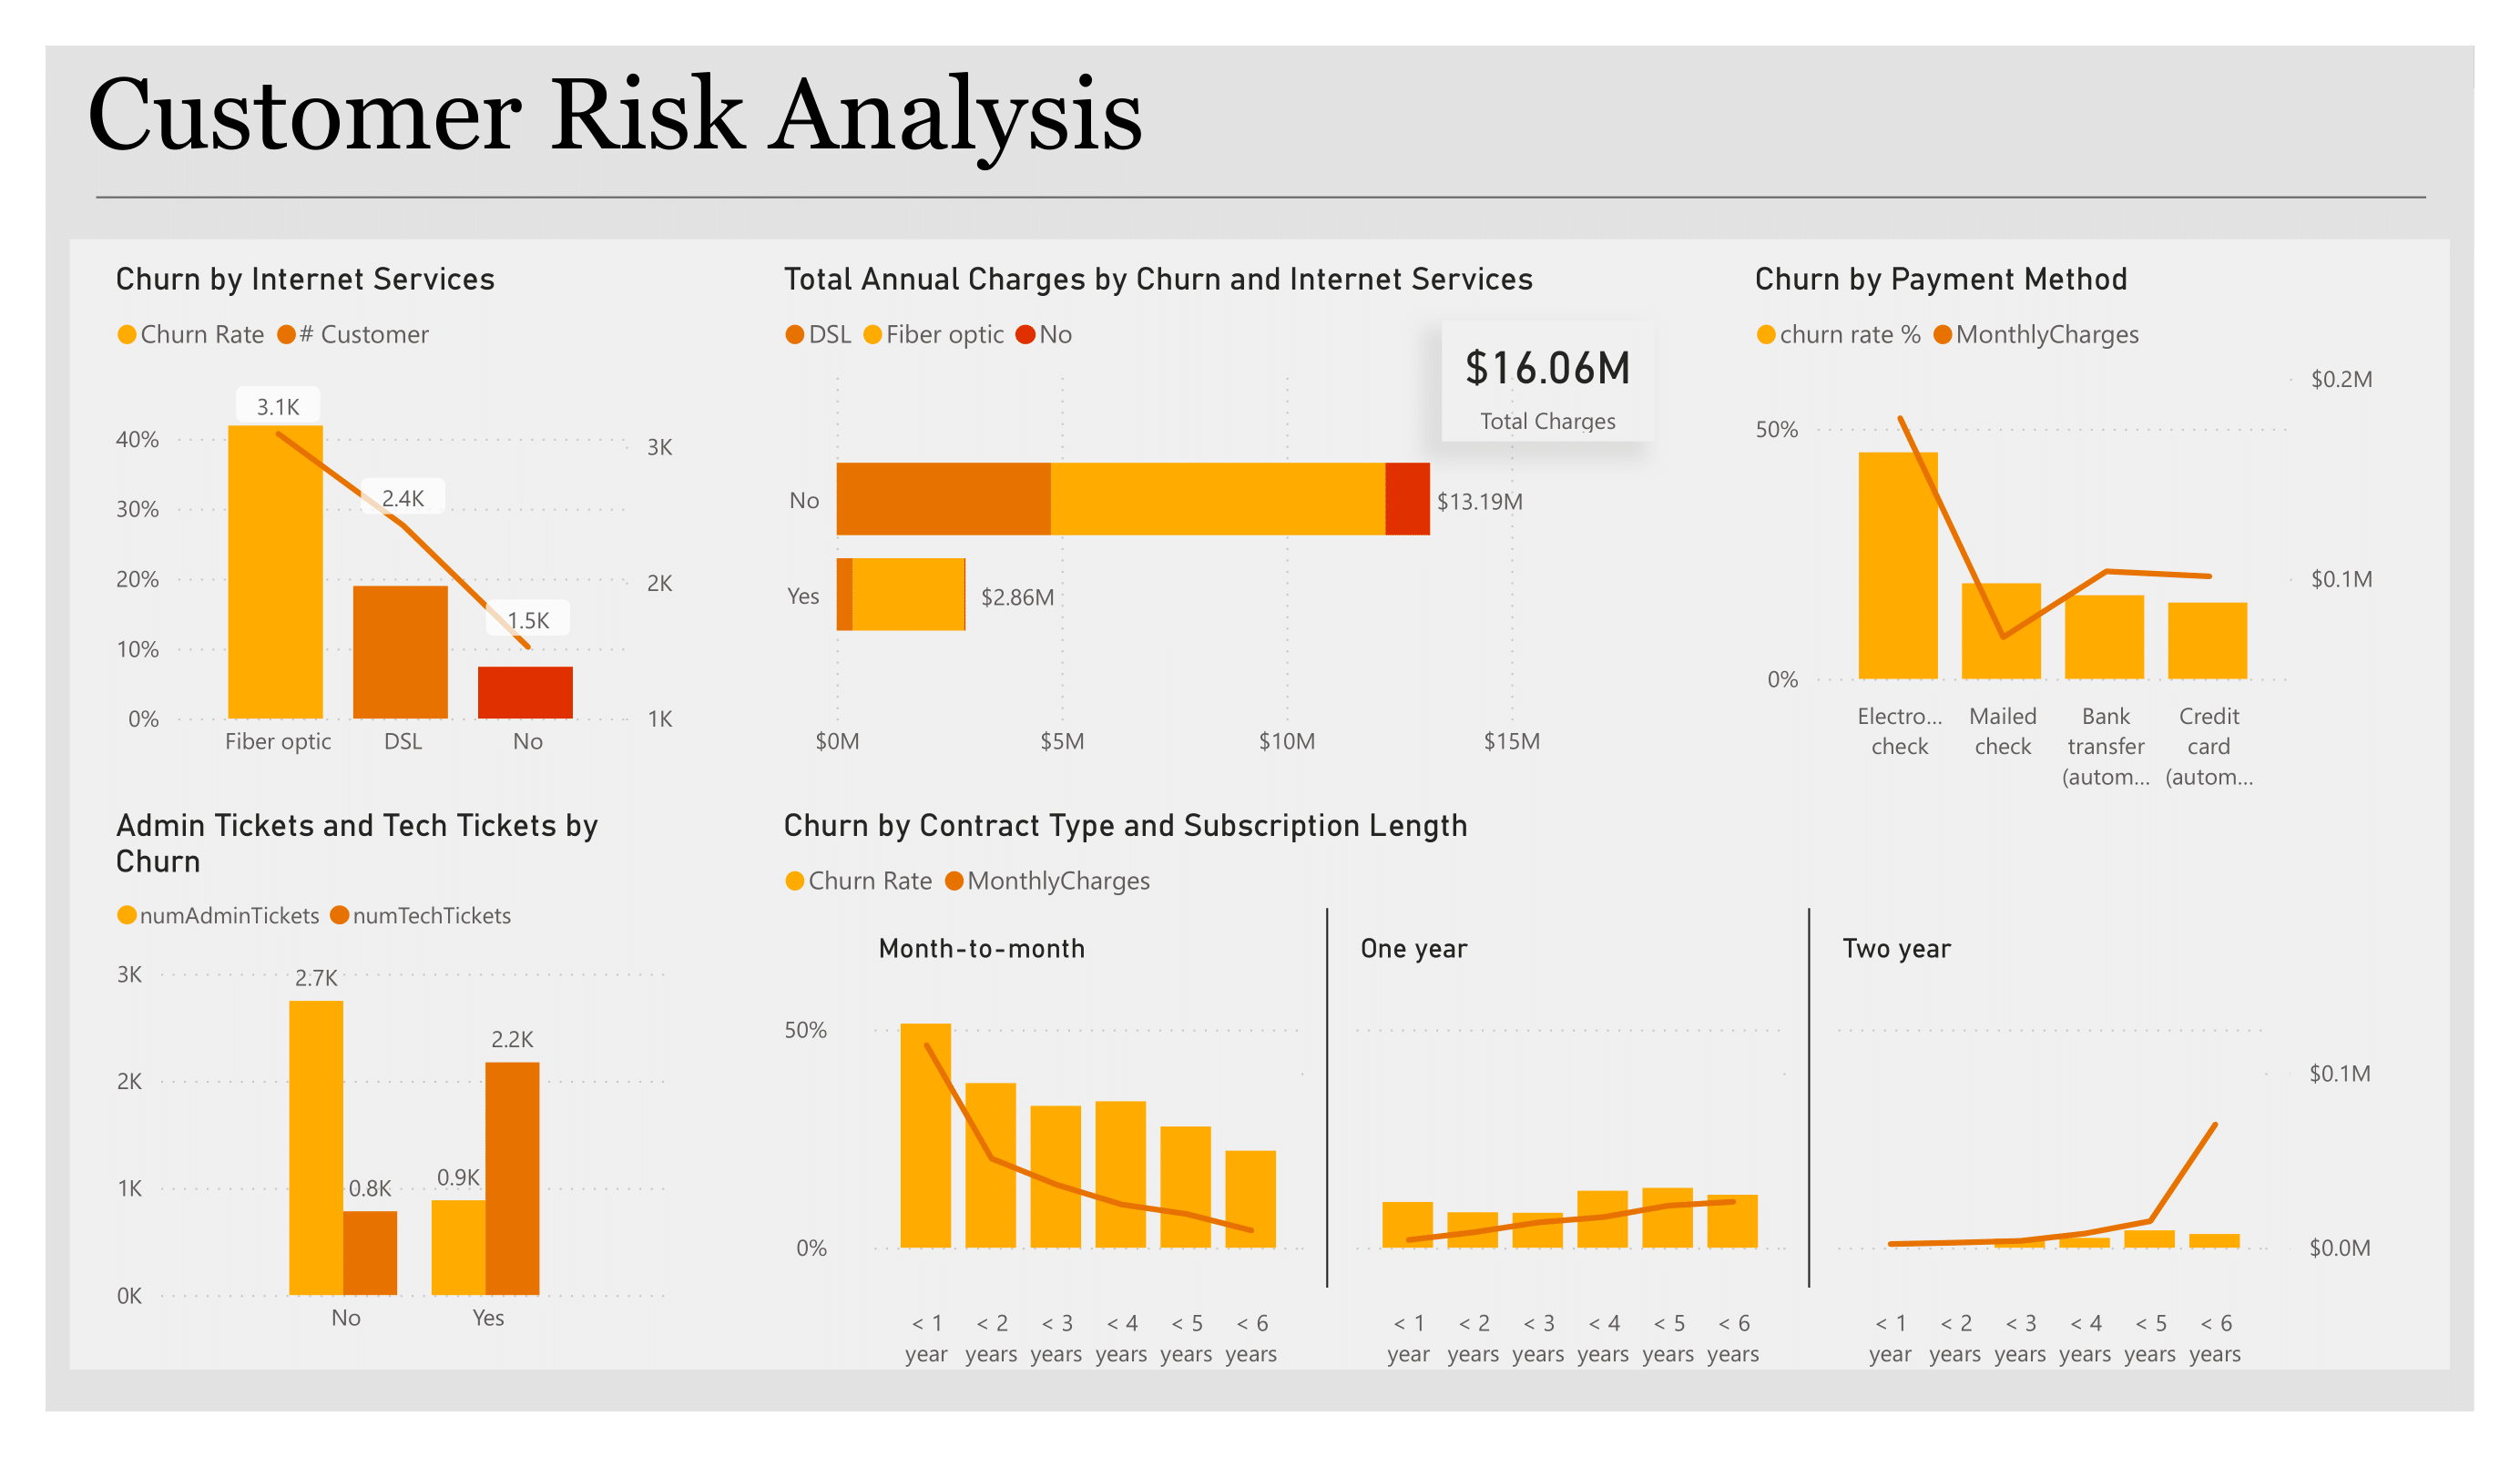
Original page 2 / customer risk analysis dashboard
Compare churn signals across the whole customer population
Unlike the explorer page, these charts use all source customers so the churn rate can be compared to the total population in each group.
Internet services
Churn rate by internet service
The original page combines customer count and churn rate. This accessible recreation presents rate visually and the customer count in its data table.
Payment method
Churn rate by payment method
Monthly charges are shown in the data table, alongside the rate visual.
Support workload
Admin and tech tickets by outcome
Ticket totals are shown both as a comparison chart and as a source table.
Charges by churn & service
Underlying charge totals
Contract type & subscription length
Churn rate across contract and loyalty groups
Month-to-month
One year
Two year
Stakeholder decision playbook
Use the report to design a testable response
| Signal | Question to validate | Recommended action | Accountable owner | Success measure |
|---|---|---|---|---|
| Explore churn concentration by contract, tenure, payment and service profile. | Which combinations remain material after controlling for the cohort size? | Define a governed outreach cohort and a holdout group for a specific intervention. | Retention Manager | Churn and offer-acceptance rates for cohort versus holdout. |
| Churned customers have technical tickets in total. | Which incident types or recovery journeys recur before churn? | Link ticket reasons to account outcomes and test proactive service recovery. | Customer Care & Technical Support Lead | Repeat-ticket rate, resolution time and cohort retention. |
Analysis source: 02 Churn-Dataset.xlsx. Both PBIX report pages were inspected read-only to match the intended report structure.
View the two original Power BI pages used as report-layout reference