Task 1 / one source report page
Call Center Trend Analysis
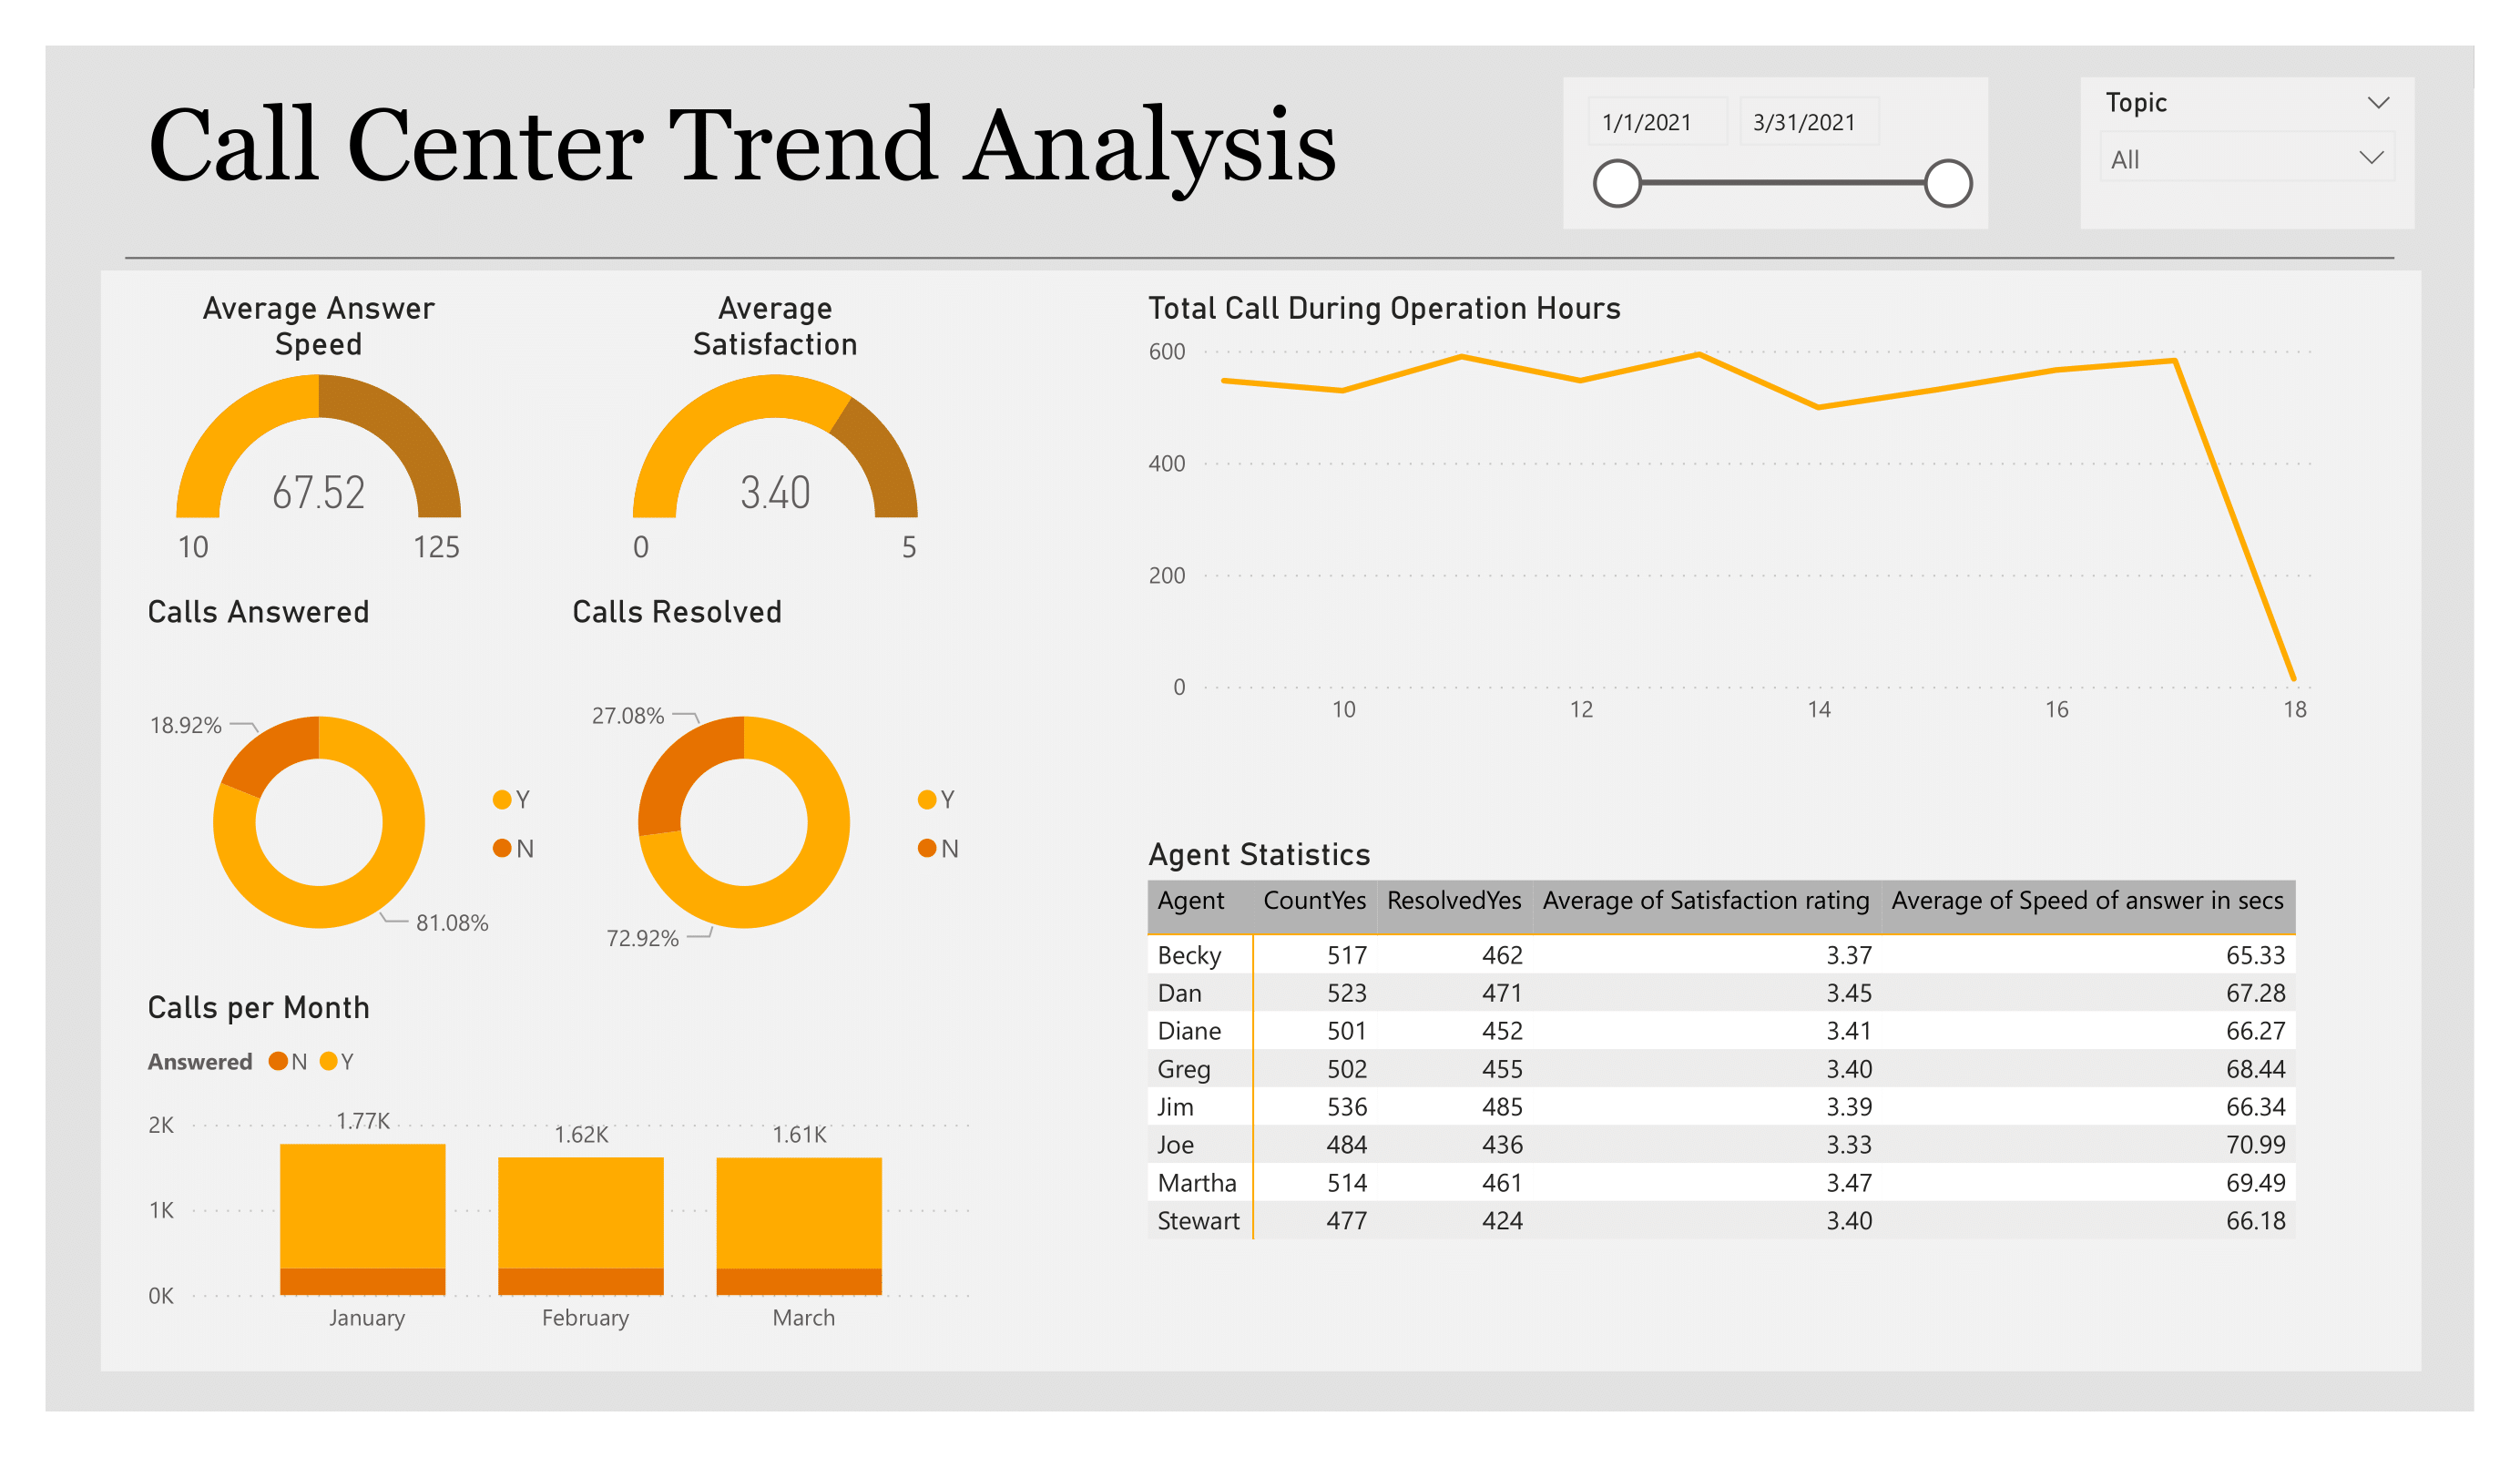
A data-driven recreation of the original operational report: calls are analysed directly from the supplied workbook and rendered as native web charts.
Original report findings
Access, resolution and customer experience
Every number and chart on this page is populated after loading case-metrics.json, generated from the original Task 1 workbook.
Calls answered
Answer outcome
Answered versus not answered across all 5,000 records.
Operating hours
Total calls during operation hours
Call volume by hour, matching the original line-chart finding.
Calls resolved
Resolution outcome
Resolved versus not resolved across all source records.
Monthly demand
Calls per month
Answered and unanswered calls by month.
Agent statistics
Operational evidence by agent
The original report’s agent table is reproduced from the source records; it is a conversation starter, not a performance judgement without workload context.
Analyst decision playbook
Turn the report into an accountable next step
| Signal | Question to validate | Recommended action | Accountable owner | Success measure |
|---|---|---|---|---|
| of calls were answered. | Does unmet demand cluster by hour, topic or queue? | Review interval demand and routing before choosing a staffing or routing experiment. | Contact Centre Operations Lead | Answer rate with demand and staffing coverage. |
| of all calls were resolved. | Which unresolved reasons create repeat contacts? | Analyse hand-off and unresolved reasons; test a knowledge-base or escalation change. | Customer Care Enablement Lead | Resolution and repeat-contact rates for the test cohort. |
Analysis source: 01 Call-Center-Dataset.xlsx. The original PBIX remains untouched.
View the original Power BI page used as report-layout reference