Task 3 / two source report pages
Diversity & inclusion analysis
Two source-driven views recreate the workforce reporting themes: hiring and promotion history, then performance, executive balance and age structure.
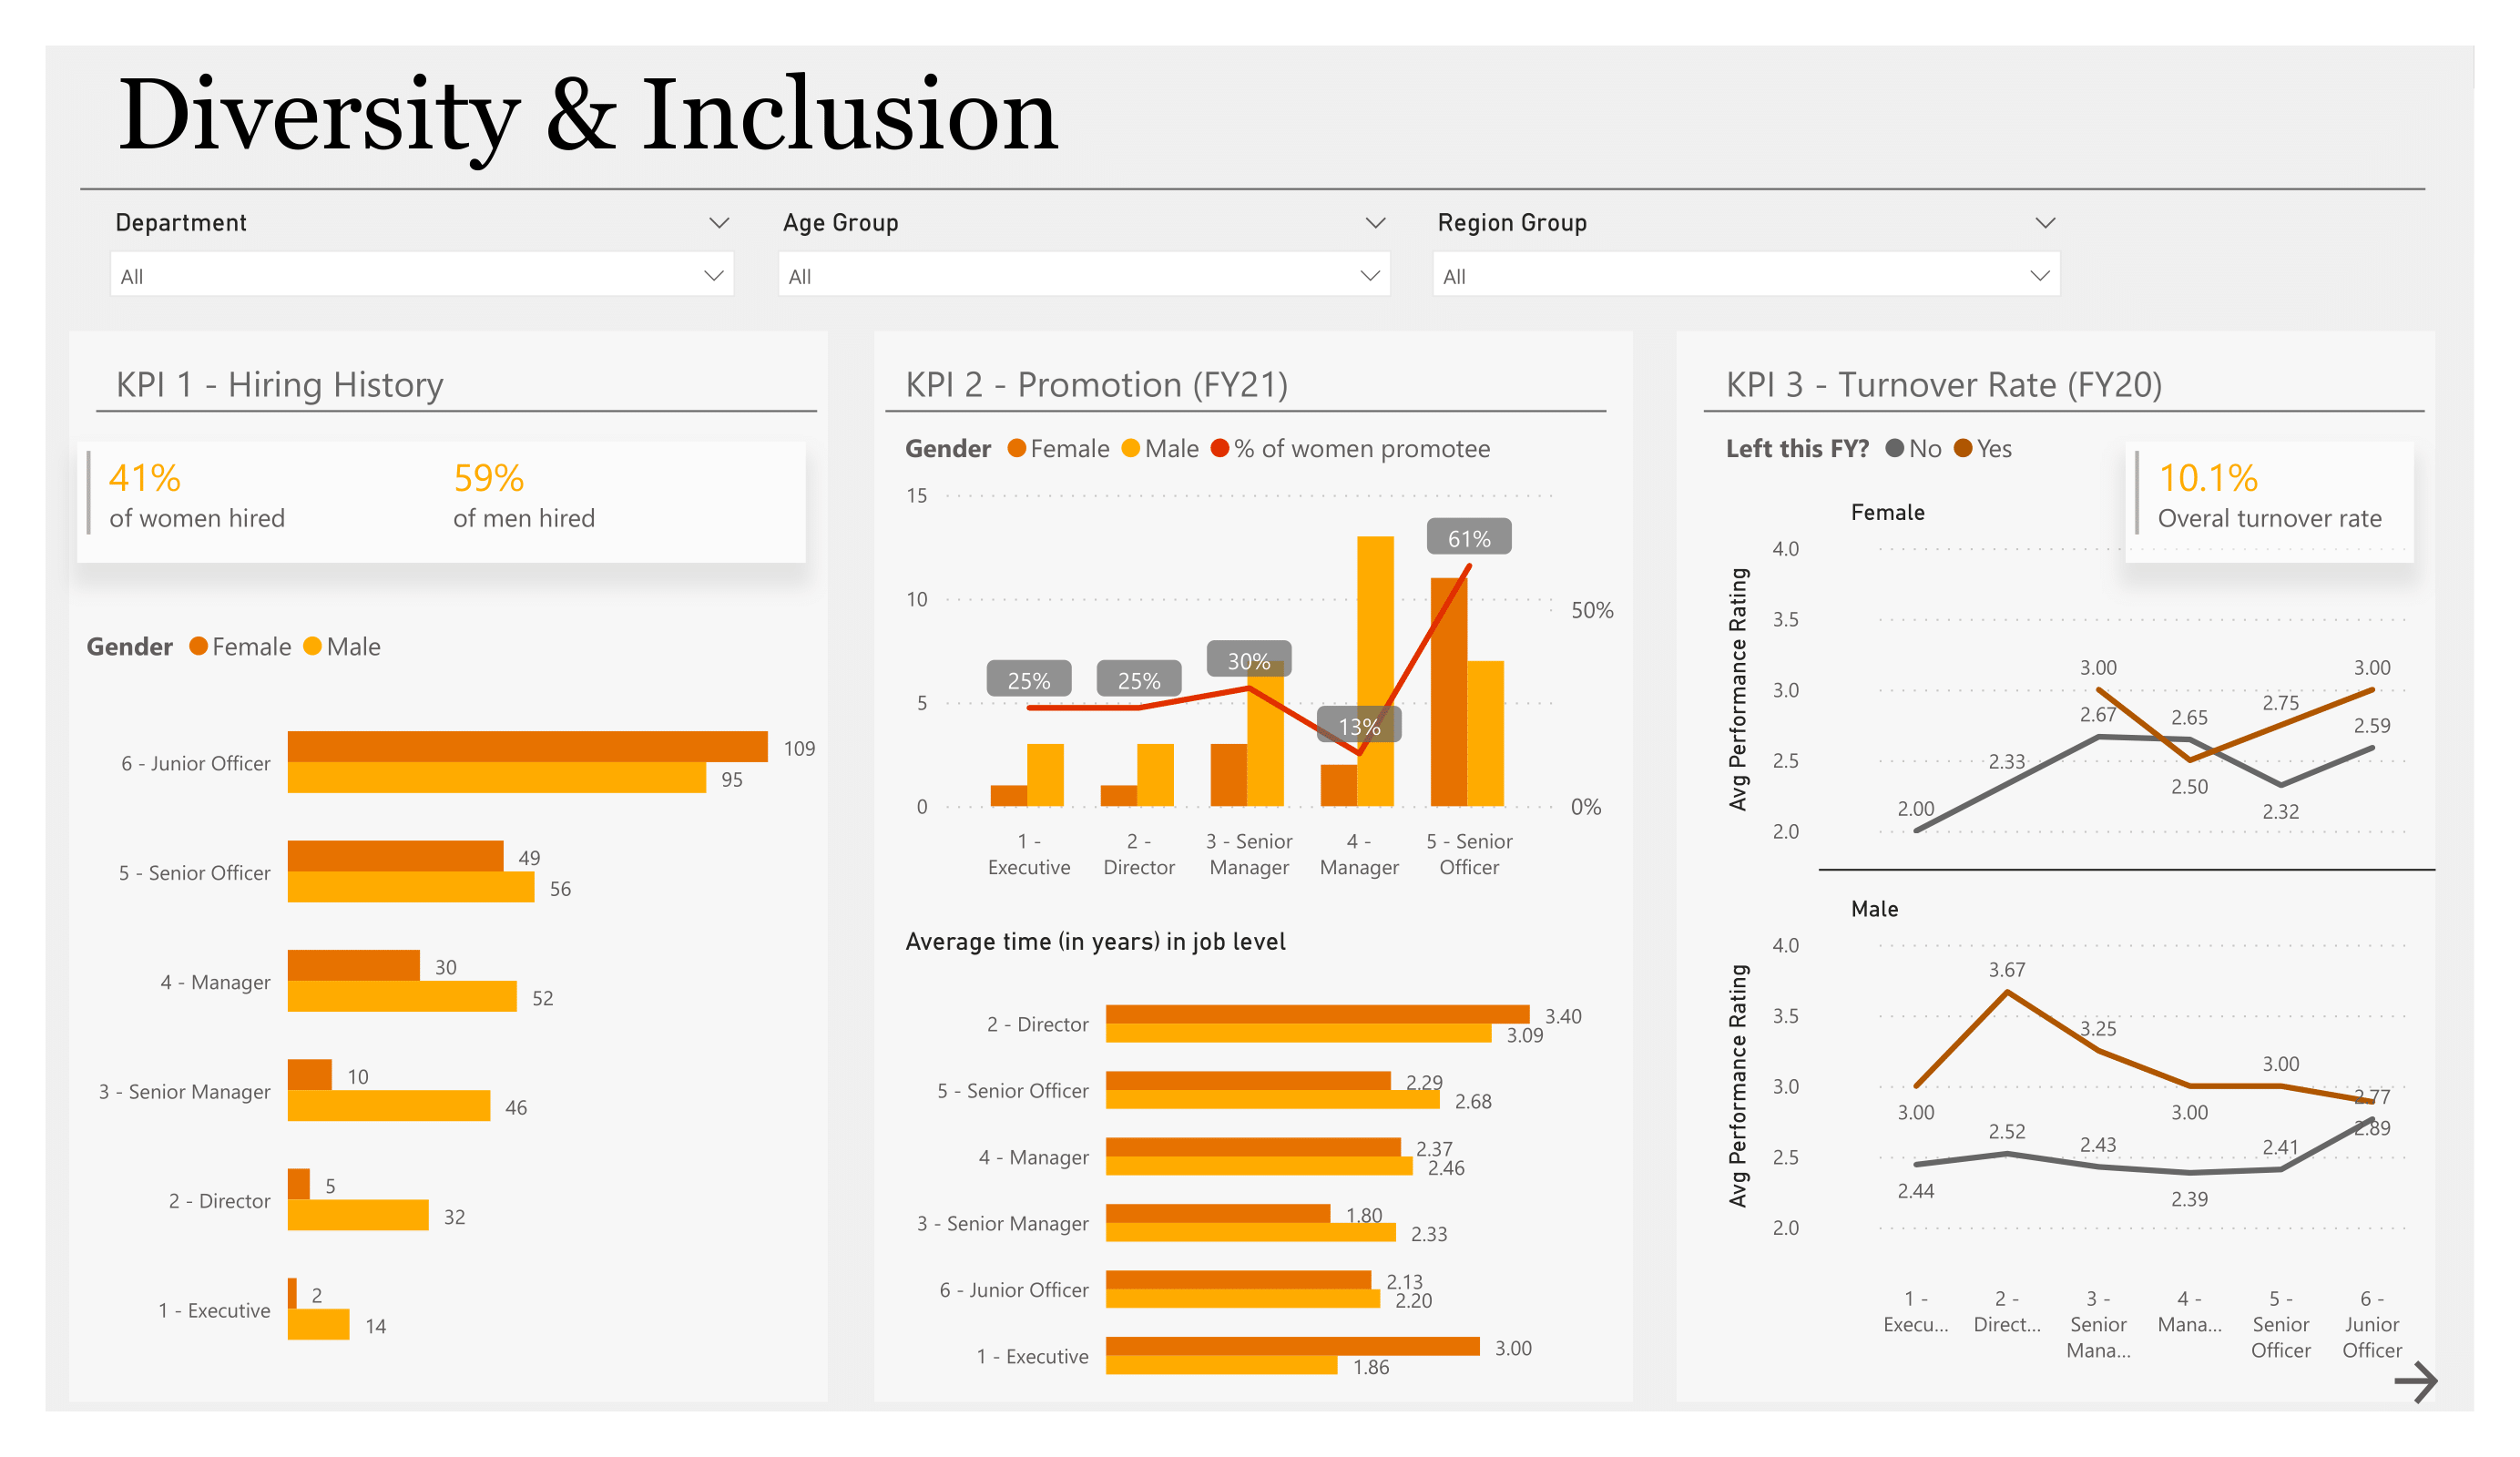
Original page 1 / hiring, promotion & turnover
Track the leadership pipeline with comparable cohorts
Charts are derived from the supplied Pharma Group AG sheet, using the original job-level, promotion and performance fields.
Metric reconciliation: the PBIX reference visual shows 10.1% turnover; the supplied workbook calculates 9.4% (47 of 500 FY20 leavers) across all employees. This site displays the auditable workbook result rather than a hard-coded PBIX value.
Hiring history
Gender by job level after FY20 promotions
The original report’s workforce distribution, rendered from raw employee records.
FY21 promotion
Promotion outcomes by job level
Counts of employees marked promoted in FY21, split by gender. A 0 means no promotion was recorded; it is not missing data.
Tenure in level
Average years in job level
Mean time in the job level at 01 July 2020.
Performance and turnover context
Average FY20 performance rating
Mean available performance rating by job level and gender. A — means no rating was recorded for that cohort, so no average exists.
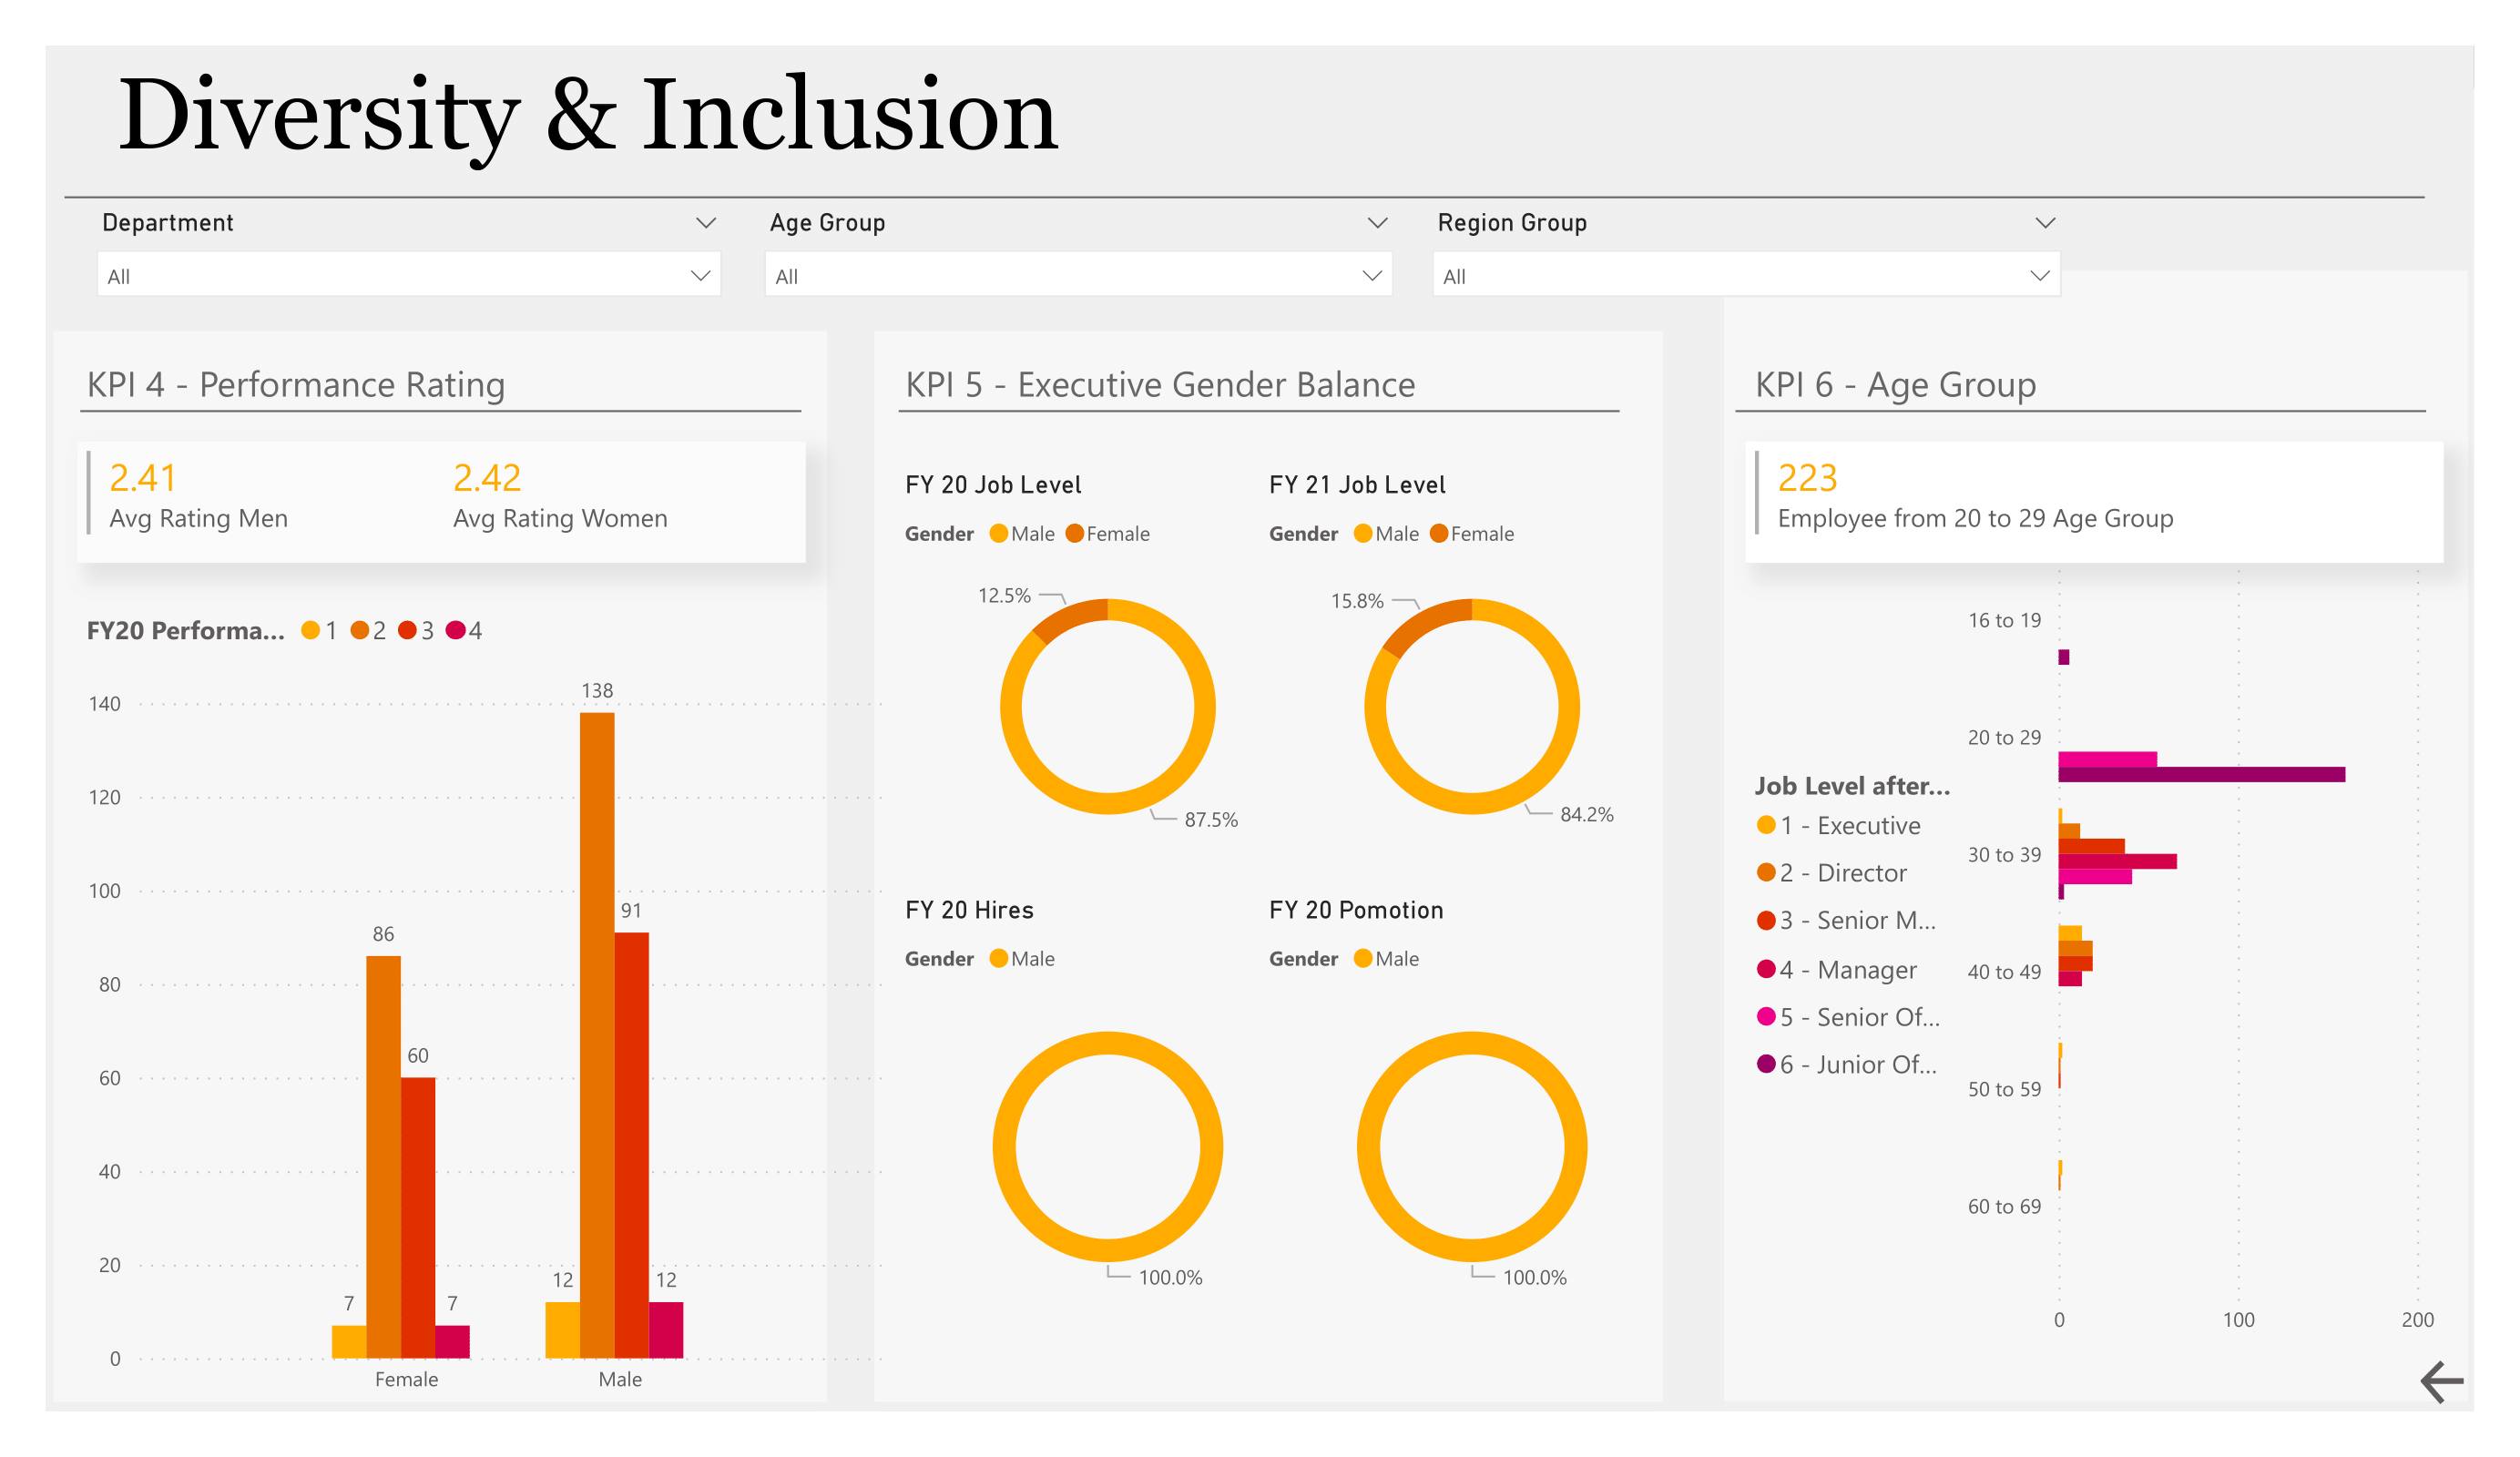
Original page 2 / performance, executive balance & age
Make representation and progression visible
This view mirrors the second D&I report page with native performance, executive-balance, promotion-rate and workforce-structure visuals.
KPI 4 / Performance rating
FY20 rating distribution
Employees with an available FY20 performance rating, split by gender.
KPI 5 / Executive gender balance
Executive composition before and after FY21
FY20 job level
FY21 job level
Promotion rate
FY21 eligible cohort
Promotion rate equals employees marked promoted in FY21 divided by the source workbook’s eligibility base group.
KPI 6 / Age and level
Age group by job level after FY21
The source counts behind the original workforce-structure visual.
Stakeholder decision playbook
Move from representation data to process review
| Signal | Question to validate | Recommended action | Accountable owner | Success measure |
|---|---|---|---|---|
| Female share changes across job levels and is at executive level after FY21. | At which transition—hiring, promotion or retention—does the pipeline change most? | Map the eligible talent pool and succession slate at every monitored transition. | Chief People Officer & Executive Sponsor | Representation and candidate-slate mix at each transition. |
| Promotion rates use the supplied eligibility-base definition. | Are performance, tenure and job-level distributions comparable across eligible cohorts? | Run a controlled promotion-process review and document any intervention. | Talent Management Lead | Promotion rate by comparable cohort and completed review actions. |
Analysis source: 03 Diversity-Inclusion-Dataset.xlsx, Pharma Group AG sheet. Both PBIX report pages were inspected read-only to match the report structure.
View the two original Power BI pages used as report-layout reference